PROJECT
PUMAS
|
UNIVERSITY UFABC - University of ABC EXTENSION PROGRAM Análise e integração de sistemas de Gestão na área da saúde YEARS 2016 MY WORK AT THIS PROJECT Infodesigner UI/UX designer TEAM Harki Tanaka Ana Paula Romani Ricardo Suyama Ronny Carbonari Gabriel Carniel João Baracho COPYRIGHT No Licence (created for a single client) Want to learn more about the Healthcare Diagram?Checkout My Master's Dissertation page to learn more!
My Master's Dissertation
|
A partnership between the University of ABC and the Health Secretary of a city in the metropolitan region of ABC (Sao Paulo) originated the extension program under the coordination of Dr. Harki Tanaka.
BRIEFINGAlthough Brazil has a governmental healthcare system (Sistema Único de Saúde- SUS), each city is responsible for their own management. The city involved in this study didn't have an unified system to manage their citizens using the city's healthcare services. The main objective of this extension project was to develop an integrated data base and platform to help the city hall and the health secretary to better manage their services.
SPECIFICATIONSThis data base and platform was not supposed to be an EMR (Eletronic Medical Record). Their immediate need was to develop a management system to register users, track which healthcare services they use and where (which facilities do they use). This data would help them understand their population needs, frequent used services and would guide them towards public health initiatives.
PLATFORM DESIGN:THE INTERFACEAs a designer, my main work at this project was to work with UI and UX of the platform and interface. The first challenge was to identify the users of the platform. This platform was supposed to be used by different people within the network. As a start point, we began developing the system used by the attendants and managers of the health centres.
PLATFORM ARCHITECTURE
Based on what the Health Secretary stated, I proposed a sketch for the platform architecture that was refined during group discussions until it looked like the picture below. This framework shows the main screens and actions that the user may take. 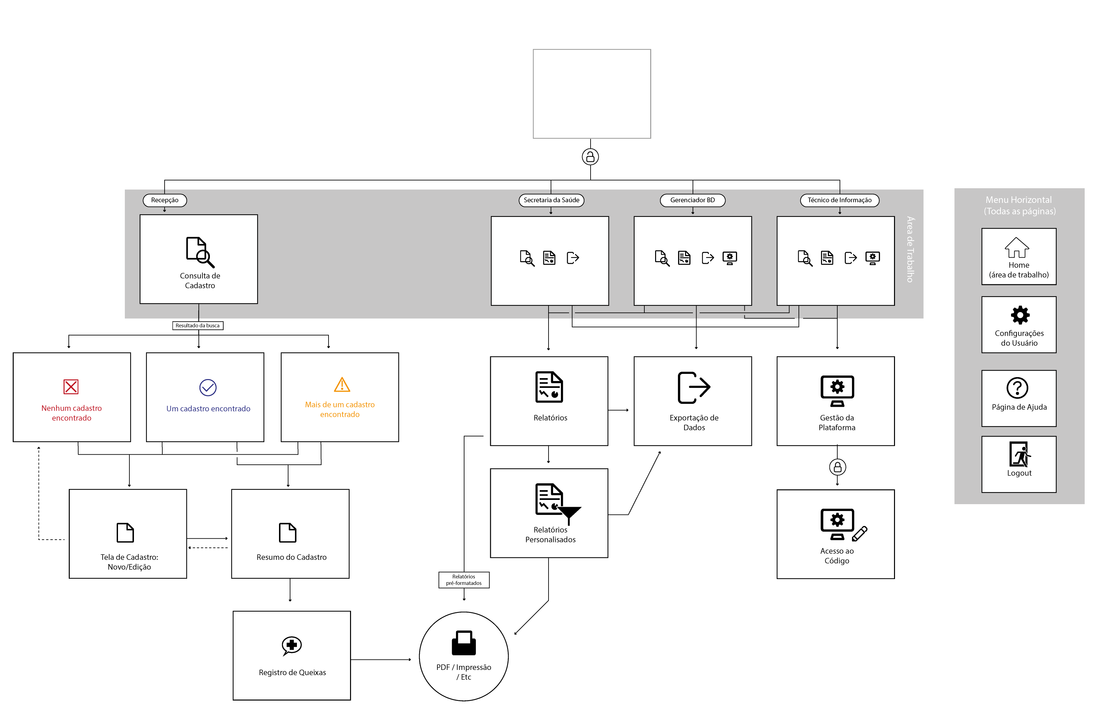
WORKFLOW
After the main framework of the platform was set, I designed the workflow and screens for each step of the first profile created: the attendants. 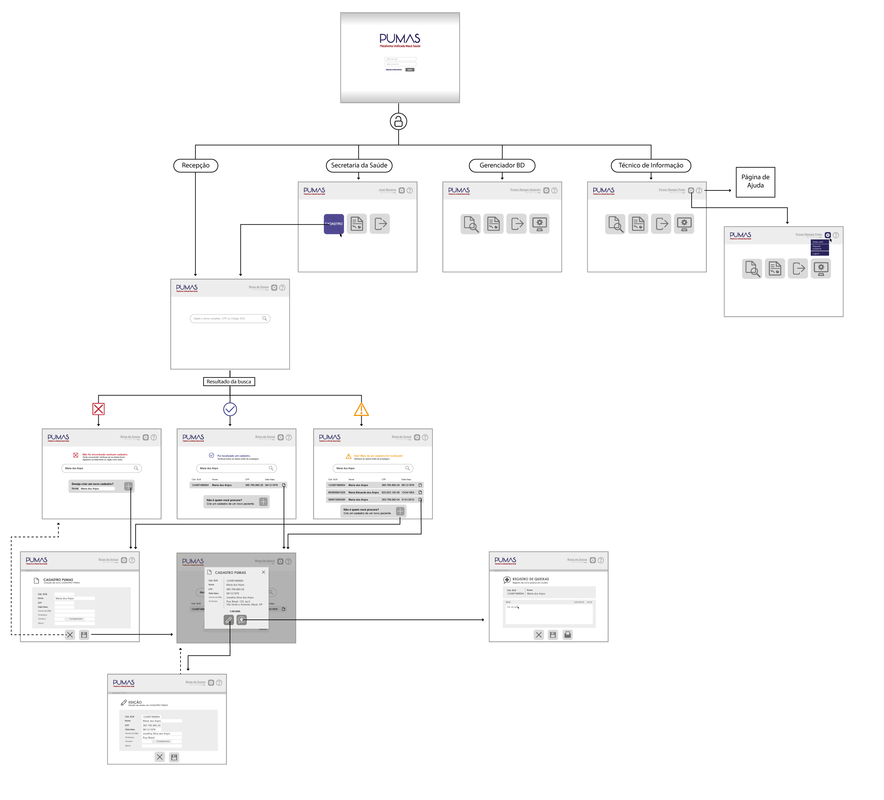
LOGO DESIGN SKETCH
I also designed a logo sketch and name for the platform, based on the city name and official colours. 
How could this platform really innovate the city's health care?One of my biggest personal goals developing this platform project was to provide some new insights on how to be innovative even with a rather simple interface design.
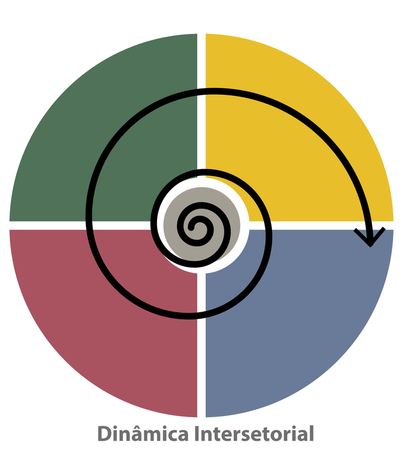
In my master's research, I developed the Healthcare Diagram to help healthcare services to be able to manage their knowledge and improve their performance by doing so. The Healthcare Diagram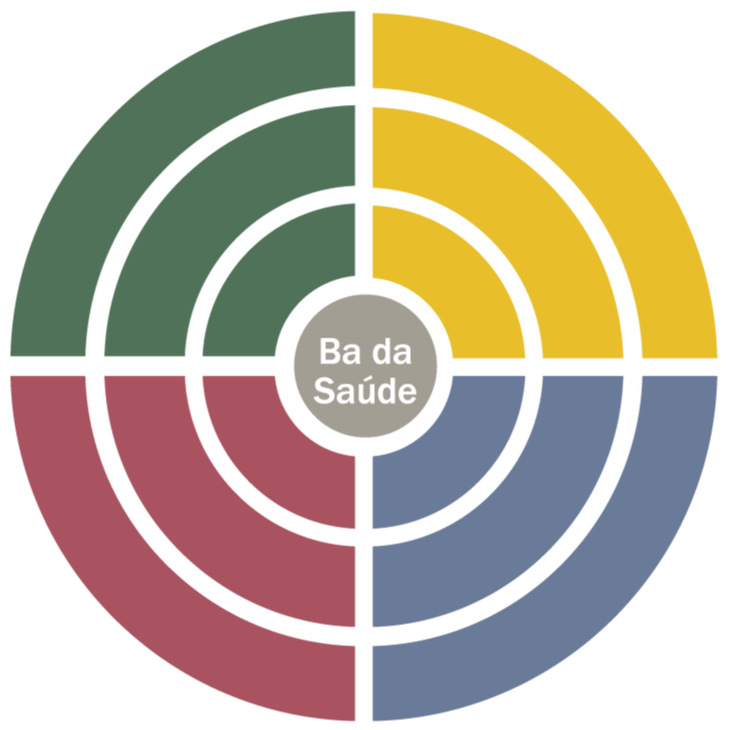
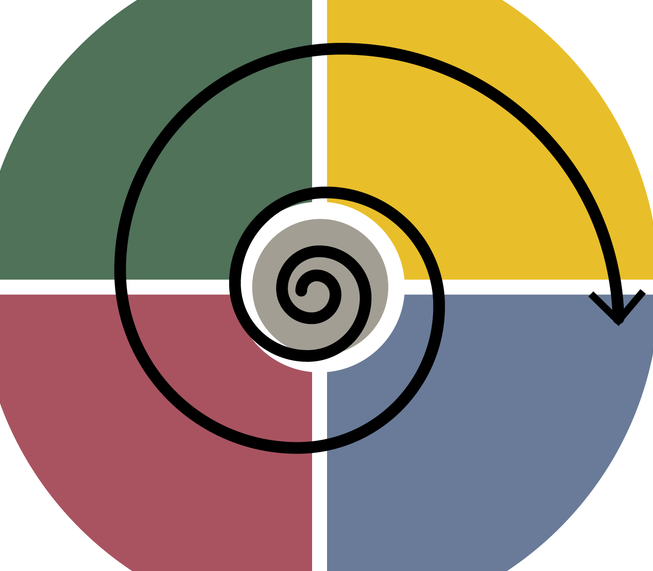
Knowledge is the main asset in a healthcare organisation, whether it is the knowledge of the healthcare professionals or the knowledge to keep the services running even during crisis situations. So the Diagram I designed combines four actors that are key to a healthcare organisation: patients, health professionals, managers and scientists (like engineers, IT people, etc). They are all gathered around the Ba, which is a definition gave by Nonaka and Takeuchi of the shared context where knowledge conversion happens.
How to use the diagram?The diagram evidences what are the possible players towards each and every healthcare organisation problem or need because it shows where the knowledge is (helping people to make strategies on how to access those knowledges).
How the Diagram could help the PUMAS Project?I used the opportunity of being part of this extension program to experiment my own "method" (it's quite not there yet... but I hope it to evolve in this direction!).
Whoever has acctually participated in a project like PUMAS knows that more common than not things are not as simple as they seemed to be at the planning stage of the project. Using the diagram shows why that happens and can leave clues on how to avoid those unwanted surprises in the middle of the project. The thing is: this project (developing a data base and platform) to manage the healthcare system's users is a simple solution to a complex problem. There are no big technological issues and to develop the interface design of the platform only requires some usability studies and iteration. But the thing is that healthcare itself is a complex thing and its inherit complexity might turn into confusion if we don't understand the problem properly. You can see this when we start to build the PUMAS's Diagram. The project (to build a unified registered users platform) is our Ba (our shared objective). The Health Secretary is in the red section and the University of ABC in the blue section. They respectively represents the management and the science sections of the diagram. At a first glance, there seem to be no need to involve people of the other two sections in the Platform Development Project. Physicians don't register users (they only work with the patients medical record which are not to be implemented in this platform) and the patients are not going to access the interface, they are only going to talk to the healthcare centres' attendants (and they are part of the management section as well). 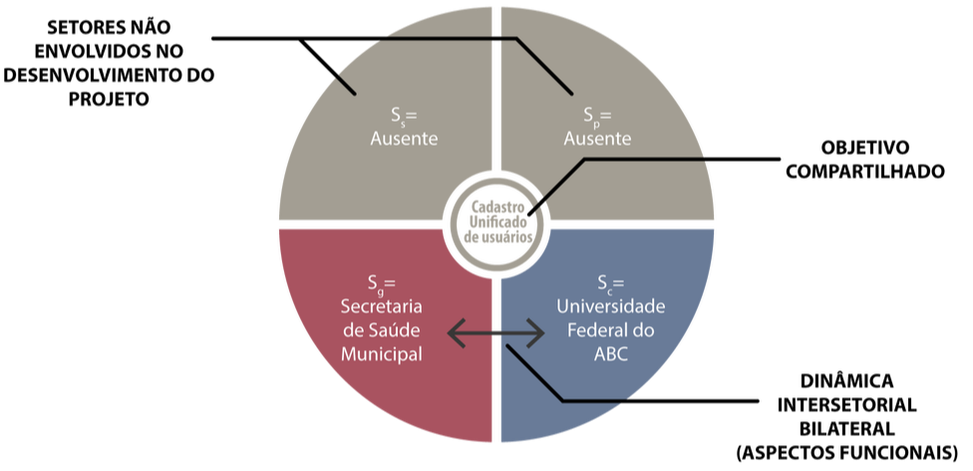
BRAINGSTORMING : What are the key knowledges to execute this project?
The use of the diagram begins with a brainstorming session to identify what the project team already knows. I suggest the use of sticky notes to make the process easier to construct and deconstruct. So, these are the firsts key knowledges we could identify: 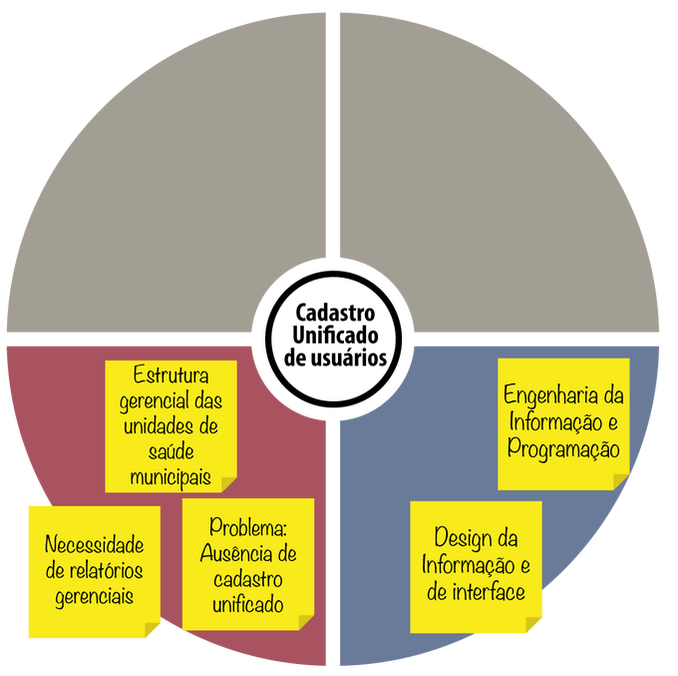
This is quite vague but they represent pretty well the project briefing. These are things we know, and that we know we know. (confusing?) But what about what we don't know yet?
That's when visual thinking and iteration process using the Diagram as a guide helps us to foresee what might get complicated during the development of the project. If we use the complete diagram, we will remember that not only is necessary to identify the sections but also the arches of each section. This little details reveals a whole lot of knowledge that we must be aware of. 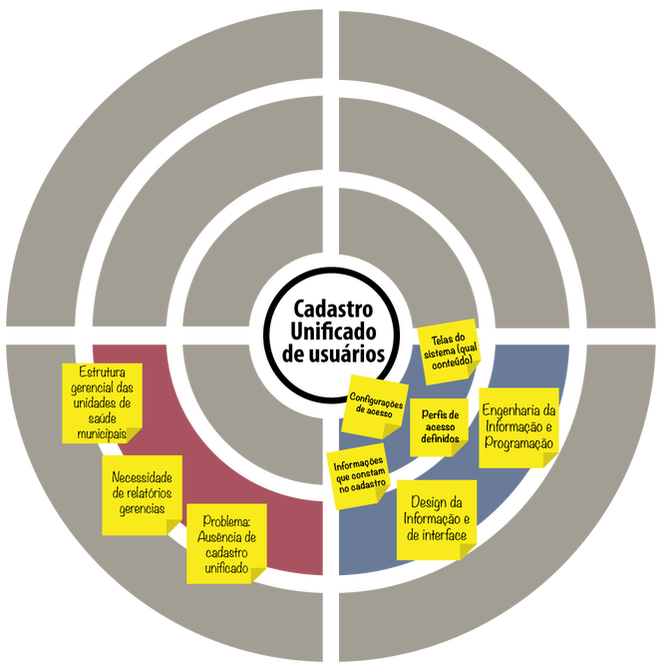
When we organise the knowledge assets we have into sections and arches we then realise that those were general knowledge not actually related to the knowledge that will be used to build the platform. For instance, if we have to create an interface to register the users, knowing what piece of information needs to be registered is very important. Another important information is to know the profiles of the users of the platform so the IT people could create the access settings.
But these knowledges are not yet available. The Secretary team involved are not sure because, again, they are at the middle arch, they are not directly involved in the registering users (that's not their job). So easily, we can see that at one point or another, it would be necessary to involve or consult other people. The process continues until, by mapping knowledges needed and who holds those knowledges, we get to something like this chart below: 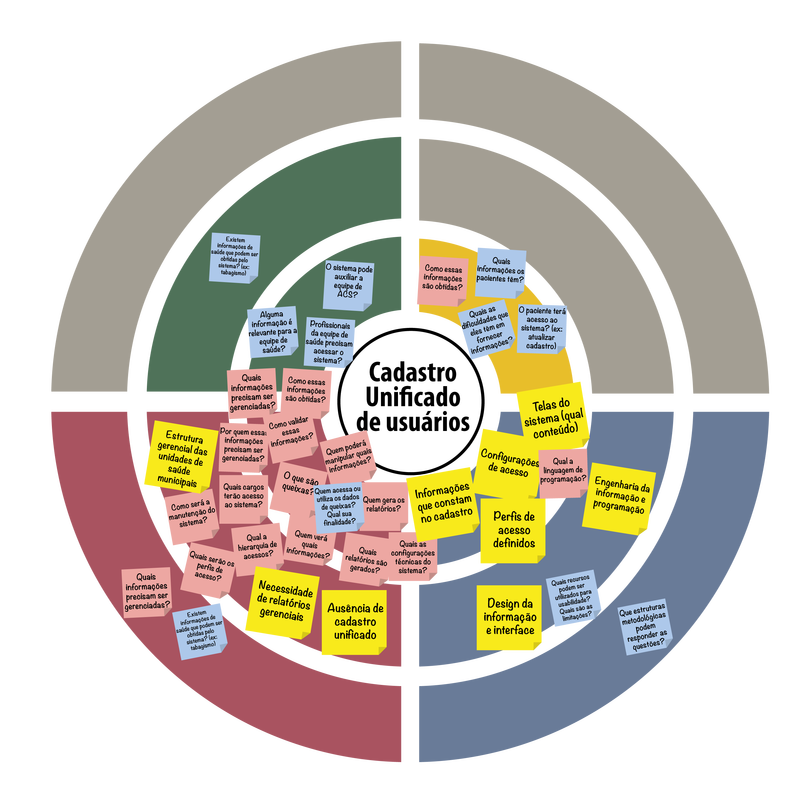
The complexity of the system cannot be subtracted even for a simple project. Knowledge management and social design can help projects like this to be aware of its complexity and provide some guidelines to create good plans and strategies. CONCLUSIONS2016 was an election year and the project was temporarily discontinued due to the changes on the City Hall and city management with the new party elected.
|